


Turtle Games: Advanced Analytics
As part of the LSE Data Analytics Career Accelerator, I was provided with (fictional) customer and loyalty point data for Turtle Games and asked to consider how they could better use their loyalty point scheme to drive more business.
I used R and Python to clean, structure, analyse and visualise the data, developing expertise in a broad range of libraries including:
In Python: pandas, numpy, seaborn, matplotlib, sklearn, nltk, statsmodel and scipy
In R: tidyverse, dplyr, plotly, corrplot, moments and car
Using these tools, I analysed the data using the following statistical and machine learning approaches:
Simple and multiple linear regression
K-means clustering
Decision tree regression & classification
Natural language processing
And checked the robustness of the models using tools including:
Statistical reporting: r squared, root mean squared error, mean absolute error
Checking for multiple colinearity (VIF)
Residual analysis including (eg) Shapiro-Wilkes testing
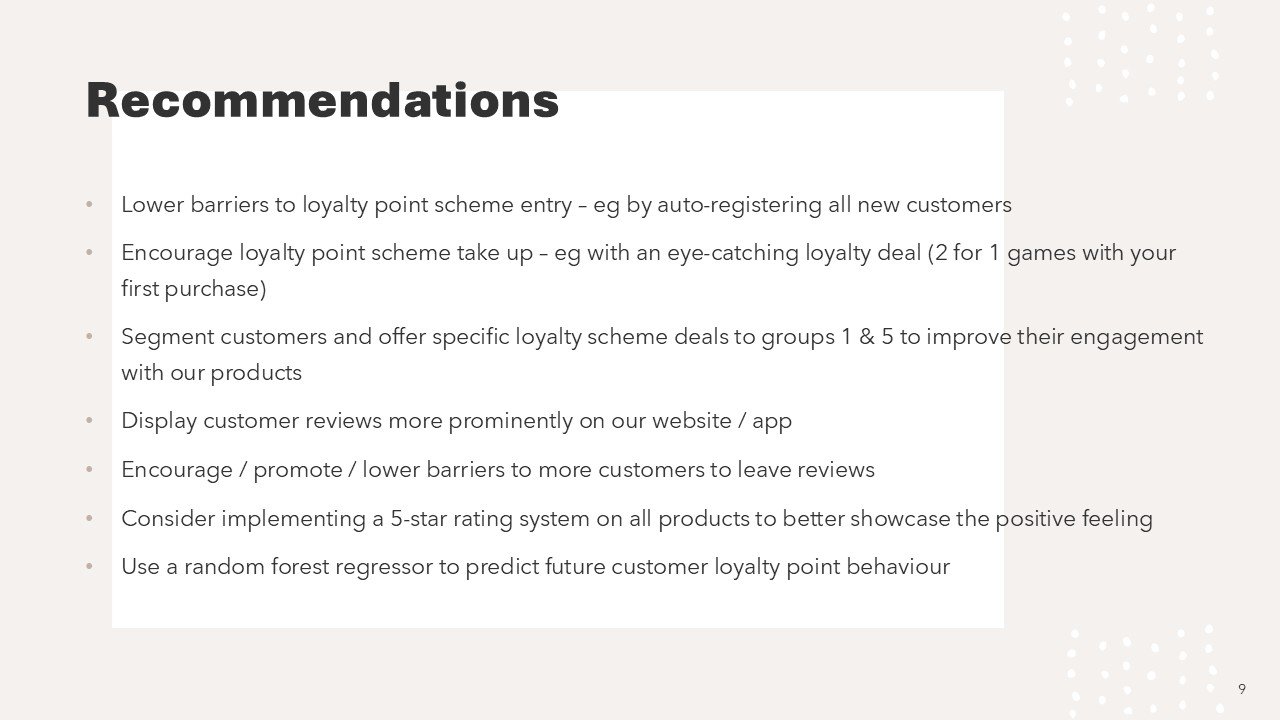
These approaches allowed me to leverage the power of machine learning to identify otherwise invisible patterns in the data, while checking the models for accuracy and applicability. This allowed me to group customers by spending and demographic information, identify potential growth markets (eg high income, low spend customers), quickly review thousands of text reviews and make clear recommendations to the business.
Don’t hesitate to get in touch at ciaran.osborne@gmail.com if you need help understanding your data, and growing your business!


